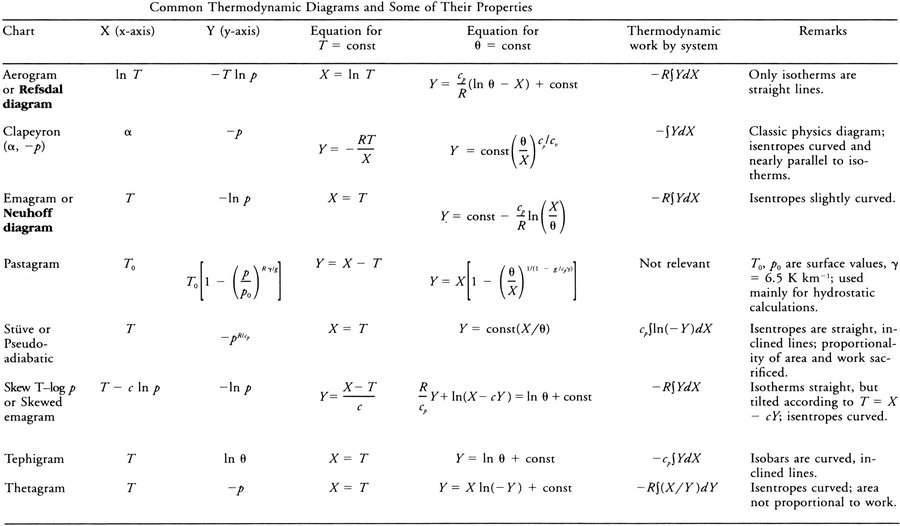
(Sometimes called adiabatic chart, adiabatic diagram.) Any chart of graph representing values of pressure, density, temperature, water vapor, or functions therof, such that the equation of state, the Clapeyron-Clausius equation, and the first law of thermodynamics for adiabatic and saturation of pseudoadiabatic processes are satisfied.
A very large number of individual diagrams fall under this general description. These common diagrams are mathematical transformations of each other. They display (reading counterclockwise about a point) isobars (approximately horizontal), isotherms, vapor lines, saturation or pseudoadiabats, and dry adiabats. When an air parcel undergoes a reversible process, the succession of states is represented on the thermodynamic diagram by a curve. A cyclic process is represented by a closed curve. On some charts the area so enclosed is directly proportional to the work done in the process, and some authors prefer to restrict the user of "thermodynamic diagram" to such charts. See table below.

